Observability
Introduction
This configuration is ideal for development teams requiring a complete testing environment with comprehensive monitoring. It deploys the default CDK OP Reth setup enhanced with debugging and observability tools, making it perfect for development, testing, and troubleshooting.
What's Deployed?
- L1 Ethereum blockchain (lighthouse/geth)
- Agglayer stack (contracts, agglayer service, and mock prover)
- L2 Optimism blockchain (op-reth / op-node) enhanced with AggKit for seamless Agglayer connectivity
- zkEVM bridge (zkevm-bridge-service) to facilitate asset bridging between L1 and L2
- Additional services:
- Blockchain explorer: Blockscout
- Observability stack: Prometheus (metrics), Grafana (dashboards), and Panoptichain (blockchain monitoring)
- Status checker: status-checker service to monitor environment health
Use Cases
- Teams needing comprehensive monitoring and debugging tools
- Testing and troubleshooting rollup environments
- Development environments requiring full visibility into blockchain activity
Deployment
args:
  additional_services:
    - blockscout
    - status_checker
    - observability
To deploy this environment:
kurtosis run --enclave cdk --args-file params.yml .
After deployment, retrieve service URLs with:
kurtosis port print cdk prometheus-001 http
kurtosis port print cdk grafana-001 http
Open the printed URLs in your browser to access metrics and dashboards.
Metrics
Adding a service that emits Prometheus metrics to kurtosis-cdk is straightforward: ensure the service has a prometheus port configured.
plan.add_service(
    name="service-a",
    config=ServiceConfig(
        ports={"prometheus": PortSpec(9090, application_protocol="http")},
    ),
)
To verify Prometheus is ingesting metrics correctly:
-
Run:
curl $(kurtosis port print cdk panoptichain-001 prometheus)/metricsAdjust the
metricspath if necessary for the service's Prometheus configuration. -
Navigate to:
$(kurtosis port print cdk prometheus-001 http)/targetsConfirm the service appears and query a service-specific metric.
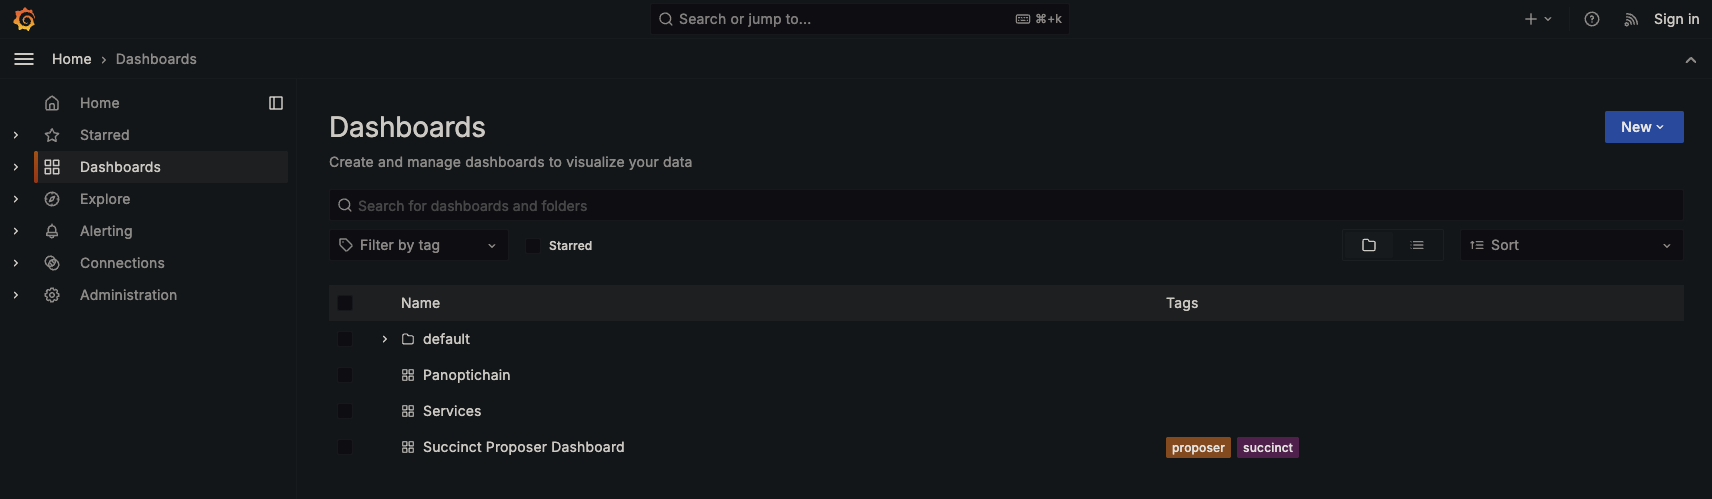
Dashboards
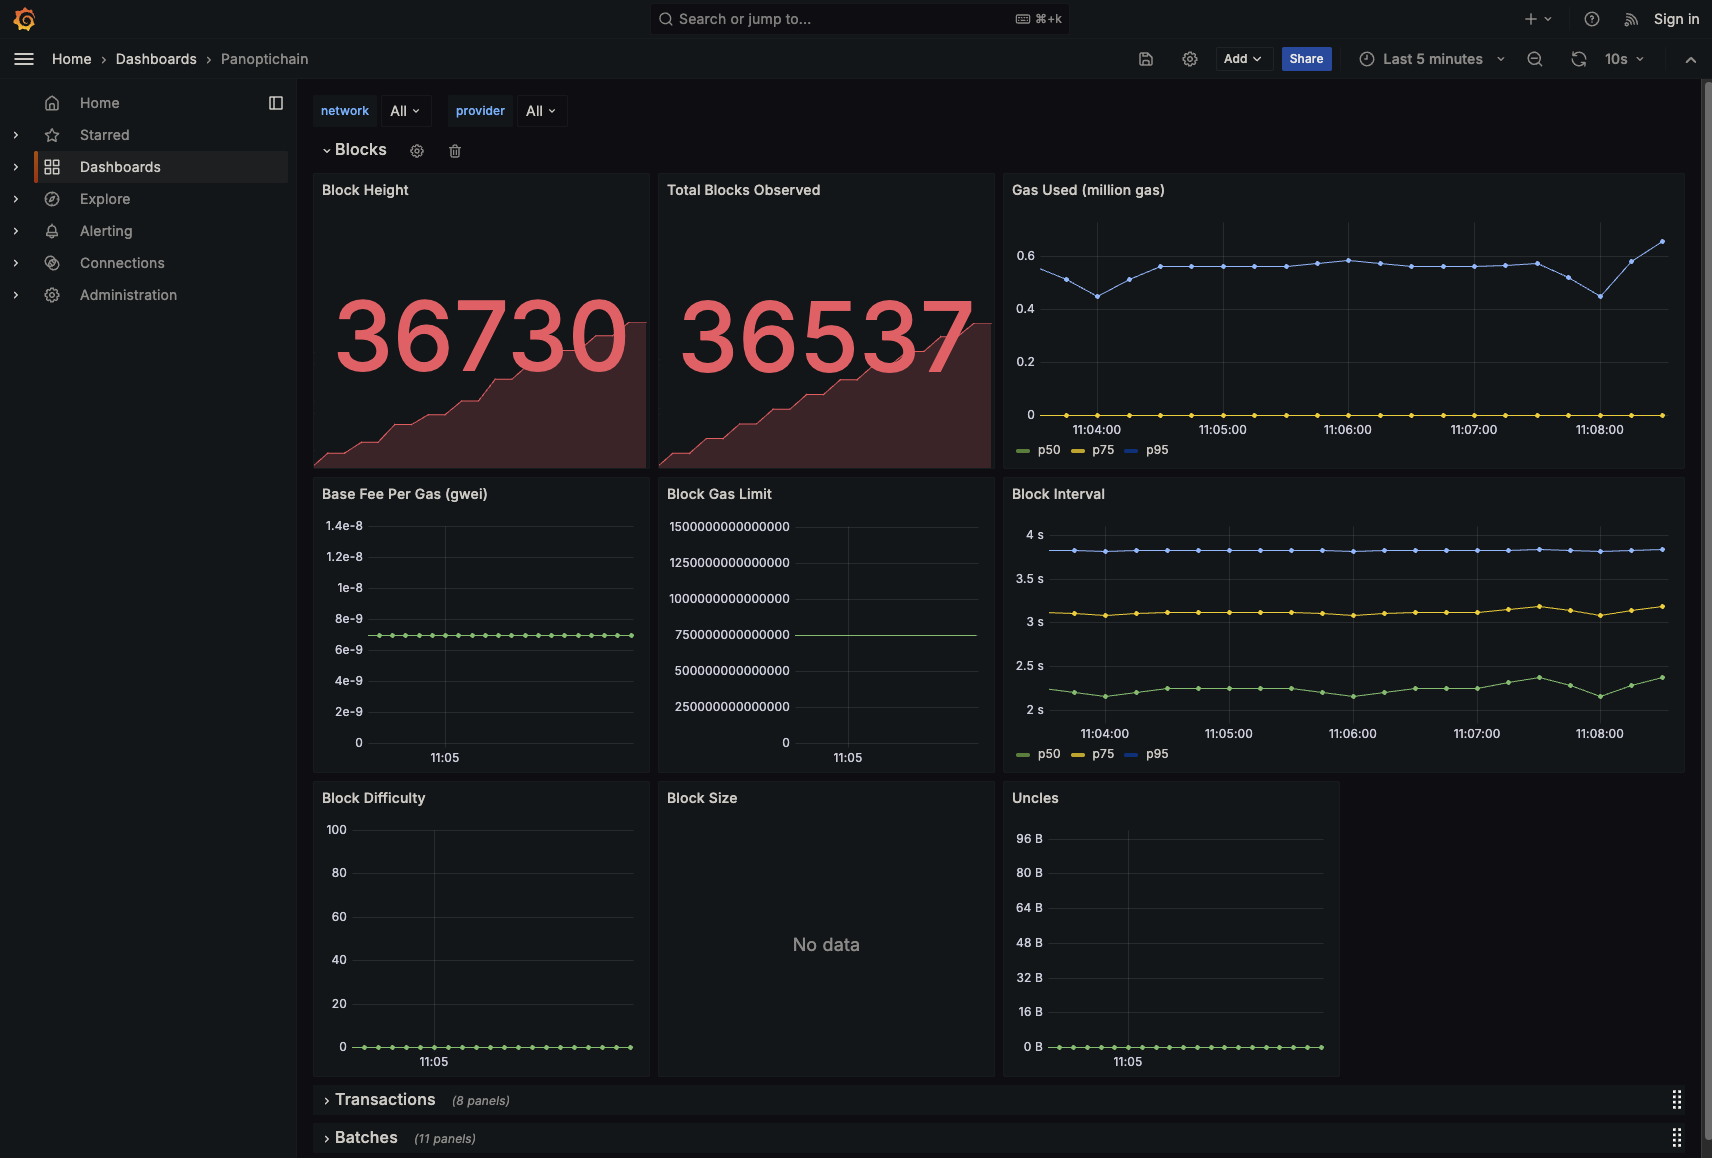
Several predefined dashboards are available, some with filters for network, provider, or job.
The Panoptichain dashboard displays metrics from Panoptichain, an open-source blockchain monitoring tool that captures data via RPC calls. All Panoptichain metrics are prefixed with panoptichain_. View all available Panoptichain metrics here.
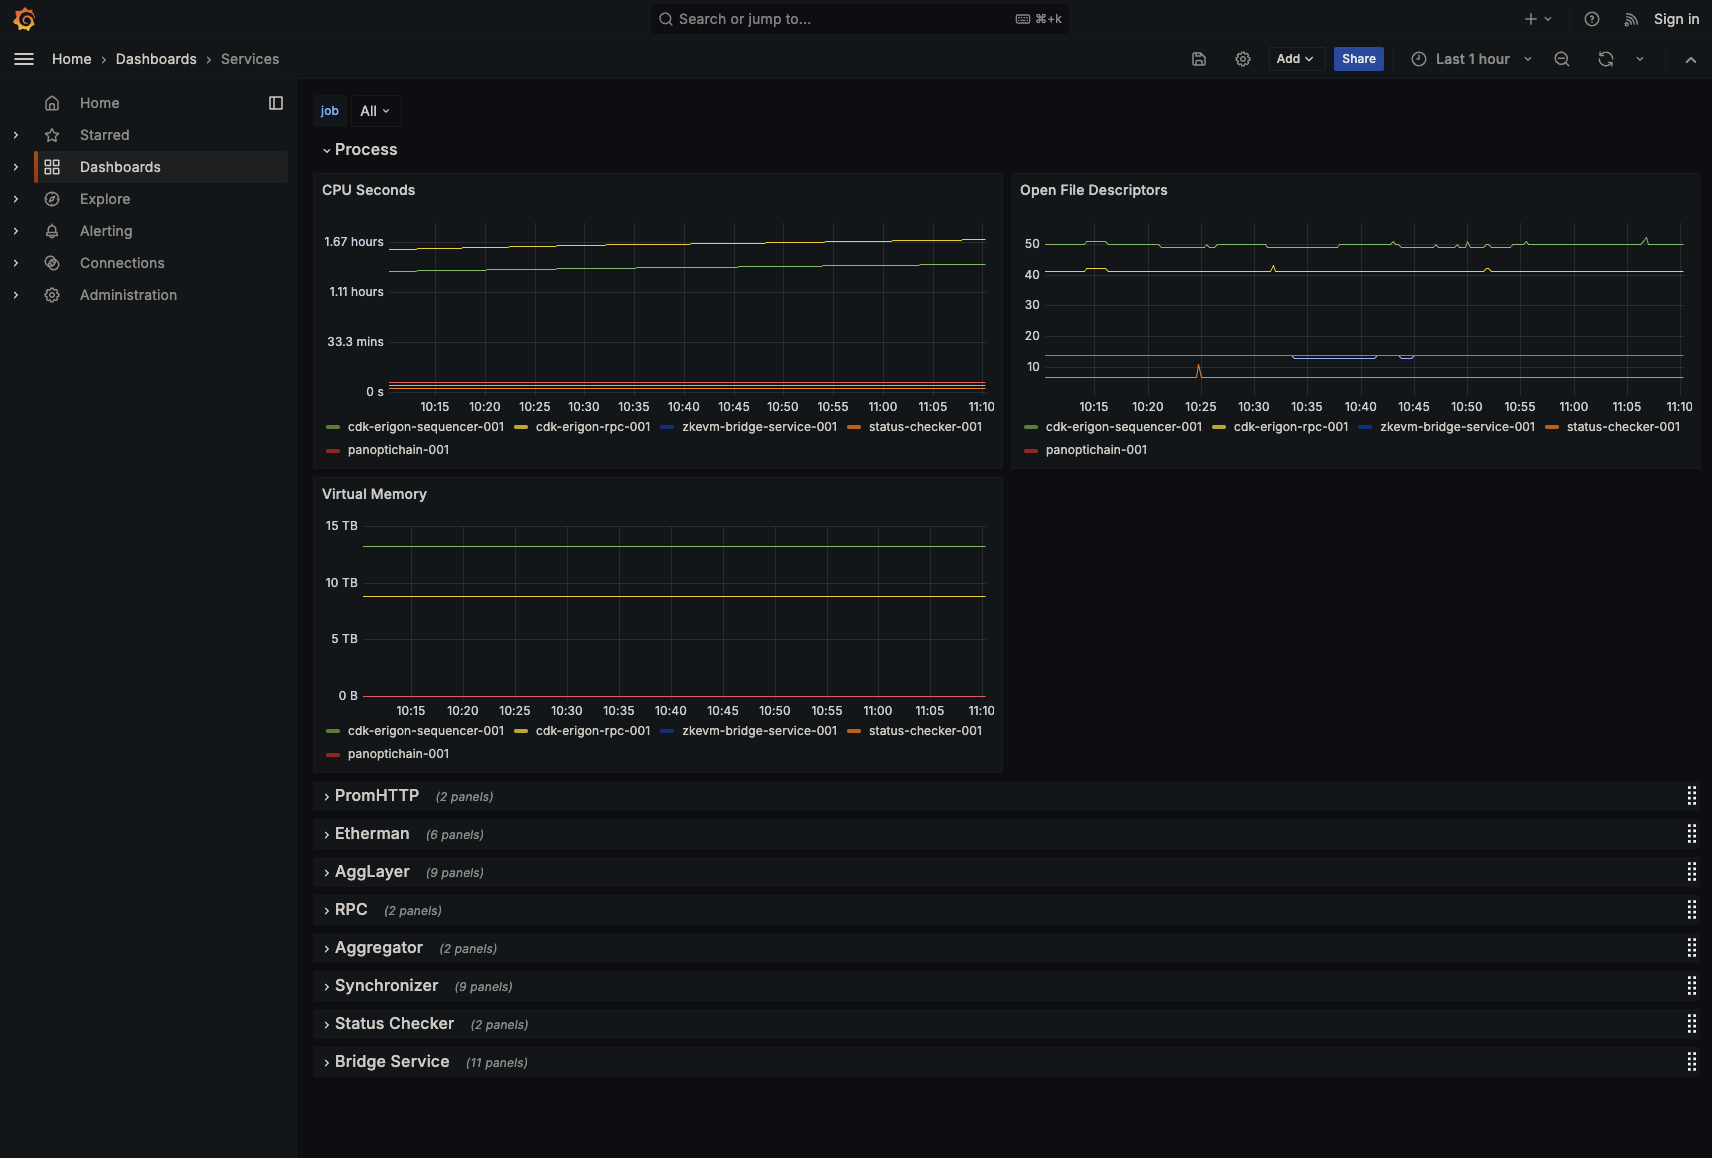
The Services dashboard shows metrics for all services in kurtosis-cdk. When adding a new service with Prometheus metrics, add a row here or create a dedicated dashboard.
Saving Dashboards
By default, Grafana dashboard changes do not persist across kurtosis runs. To save a dashboard:
- Share → Export → Save to file. Ensure Export for sharing externally is unchecked.
- Save the file to:
static_files/additional_services/grafana/dashboards - Restart Grafana or
kurtosis-cdk.
Status Checks
Status checks are scripts that assess network health. They reside in static_files/additional_services/status-checker/checks.
Writing Checks
Place each status-check script in the checks directory with a proper shebang (e.g. #!/usr/bin/env bash) on the first line so it can be executed directly. A script passes when it exits with code 0 and is considered failed on any non-zero exit code. Reference existing checks to maintain consistency and minimize false positives. Because status-check scripts are stateless and ephemeral between executions, required state must be managed externally. File-based storage or environment variables are suitable for simple state management, while a database should be used for more complex scenarios.
#!/usr/bin/env bash
cast block-number --rpc-url $L1_RPC_URL
The container running status checks provides environment variables:
env_vars = {
    "L1_RPC_URL": args.get("l1_rpc_url"),
    "L2_RPC_URL": l2_rpc_url,
    "SEQUENCER_RPC_URL": sequencer_rpc_url,
    "CONSENSUS_CONTRACT_TYPE": args.get("consensus_contract_type"),
}
Viewing Results
To view status check results, run:
kurtosis service logs cdk status-checker-001 --follow
Logs show each check's result:
[status-checker-001] {"level":"info","check":"l2-coinbase.sh","success":true,"time":"2025-06-17T19:24:20Z"}
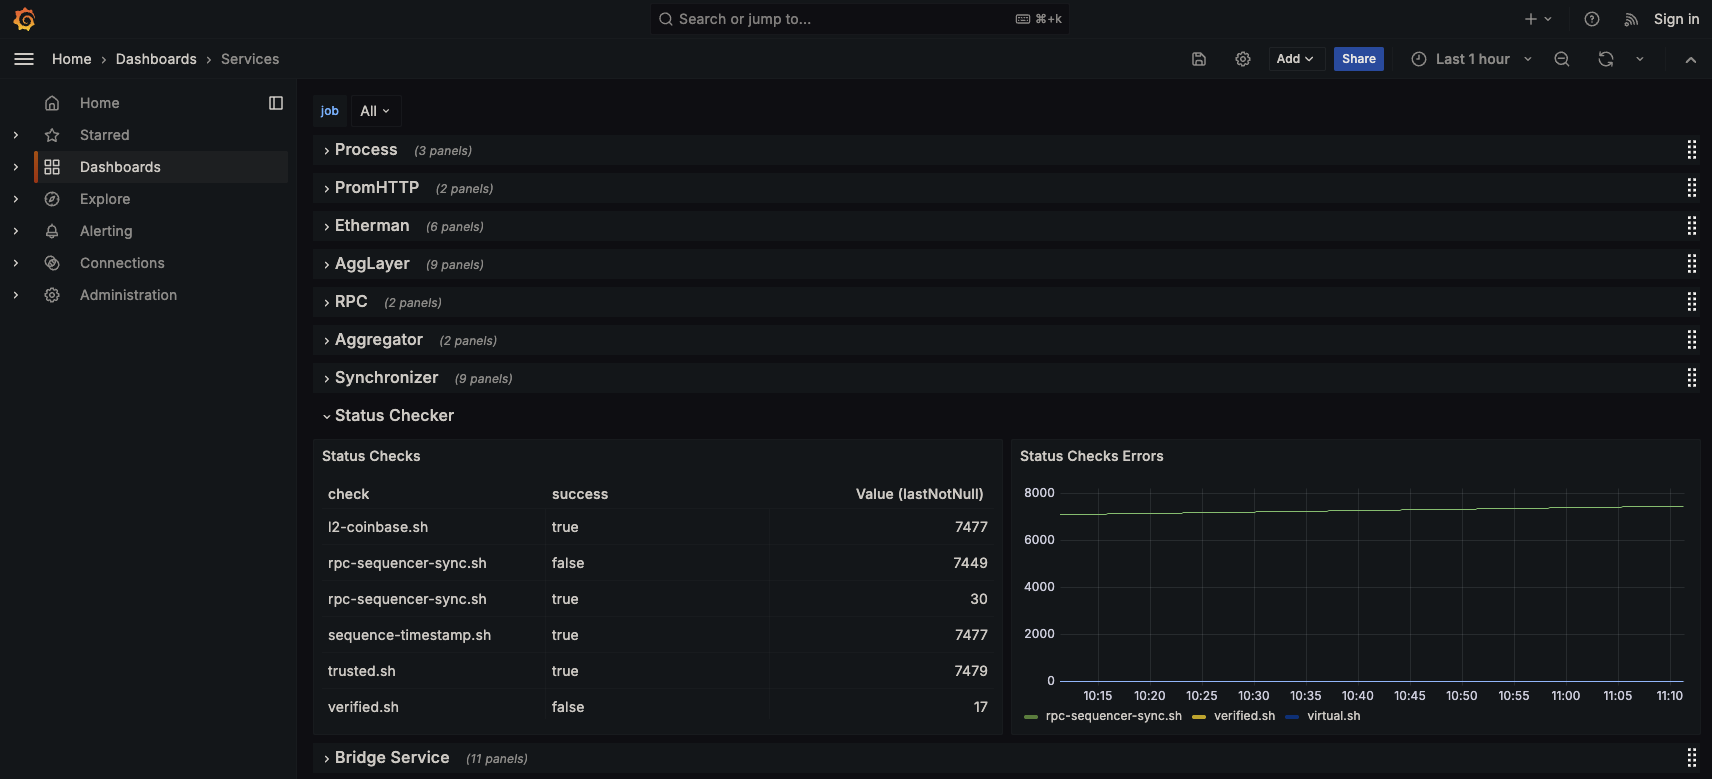
The status checker also appears in the Grafana Services dashboard:
Alerting
Alerting monitors Prometheus-ingested metrics and triggering notifications when defined thresholds are breached. A set of preconfigured alerting rules is included out of the box. It is recommended to use alerting for simple use cases where there are existing Prometheus metrics and the status-checker for more complex scenarios.
Slack Notifications
By default, Slack notifications are disabled. To enable them, set the following environment variables in grafana.star:
SLACK_WEBHOOK_URLSLACK_CHANNELSLACK_USERNAME
When enabled, Grafana will post alert messages to the specified Slack channel during a Kurtosis run.
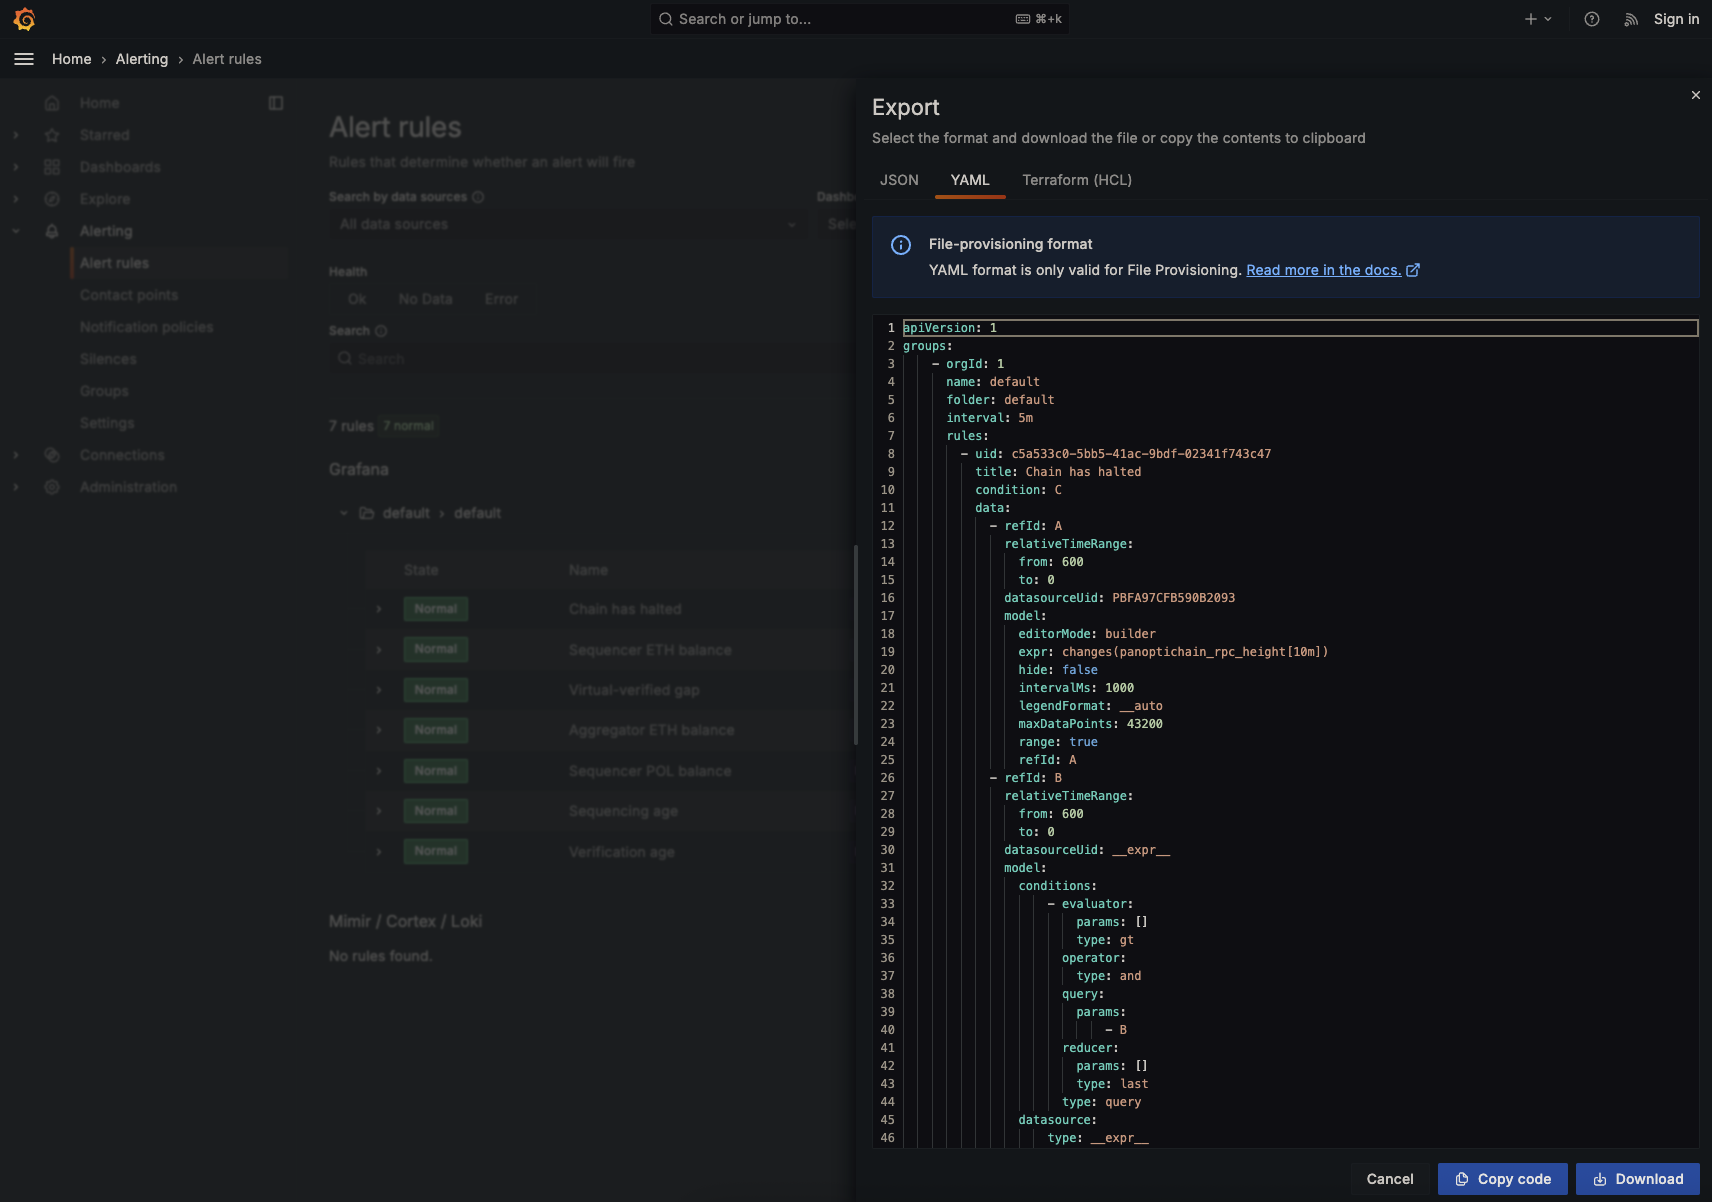
Exporting Rules
To export and persist alerting rules:
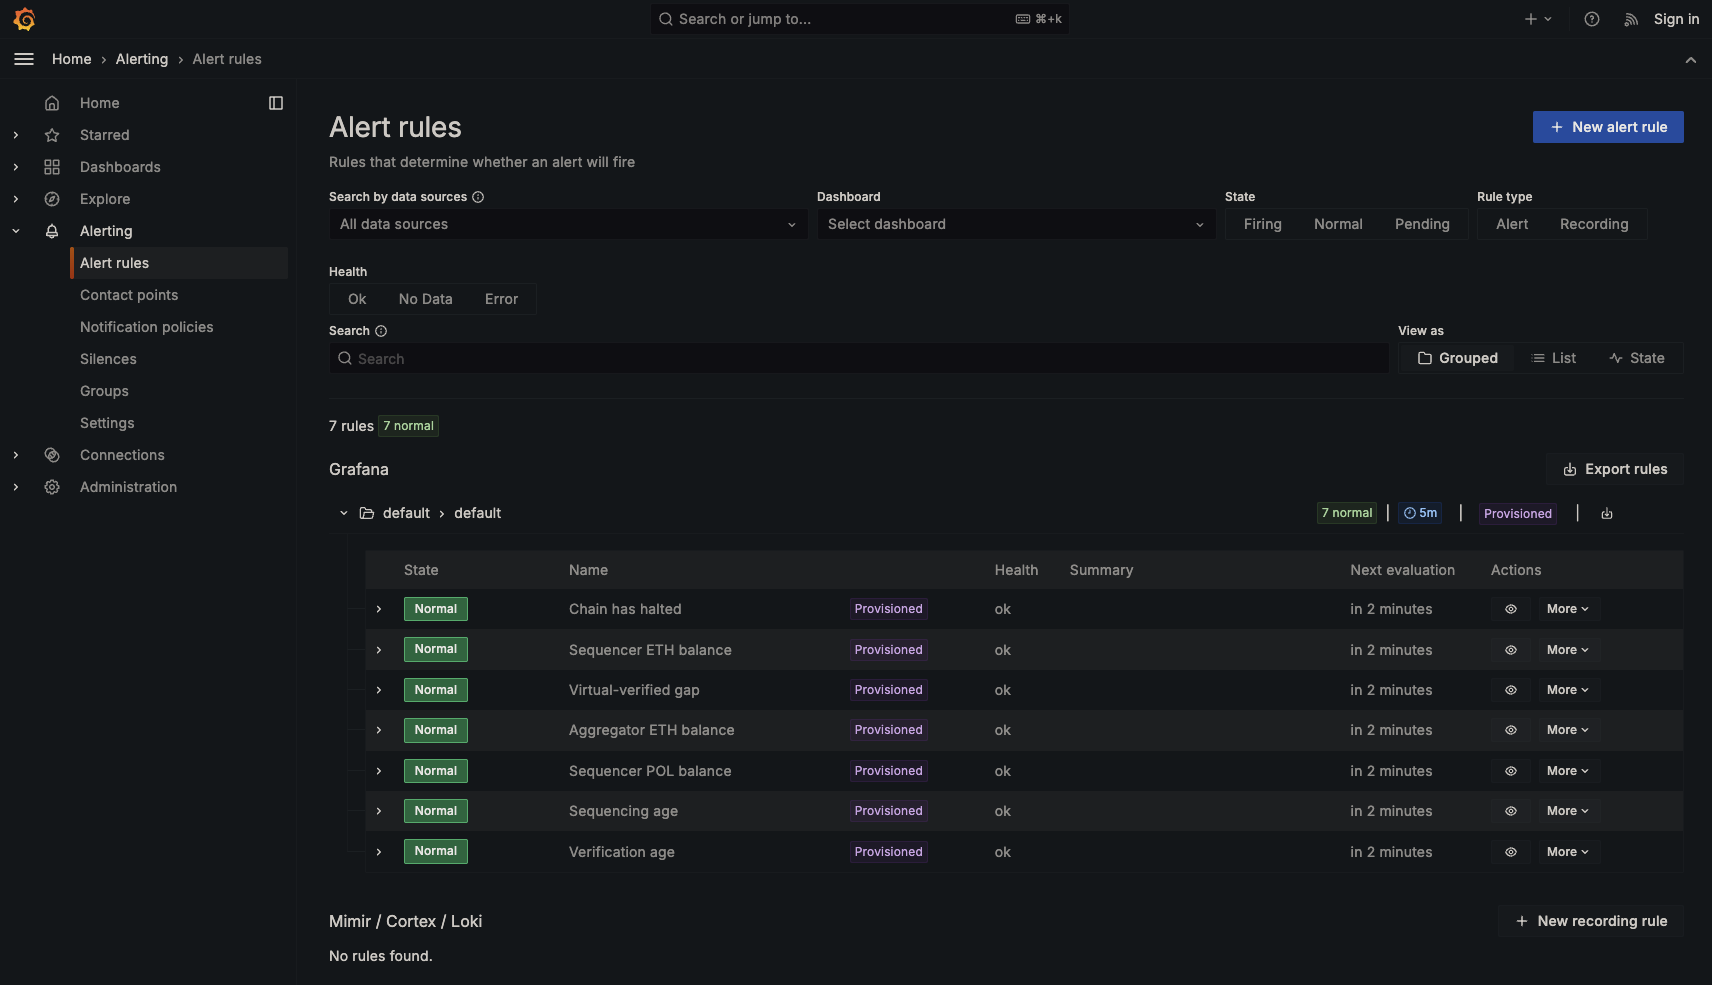
- In Grafana, go to Alerting → Alert Rules.
- Click Export → YAML → Download.
- Save the downloaded file as
static_files/additional_services/grafana/alerting.yml.tmpl.